Q1901.
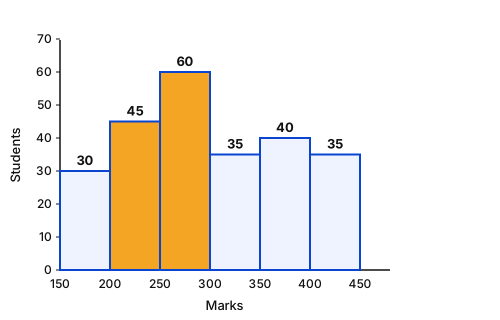
Study the given histogram that shows the marks obtained by students in an examination and answer the question that follows.
(Histogram data: marks on the horizontal axis, number of students on the vertical axis)
The number of students who obtained less than 250 marks is what per cent more than the number of students who obtained 400 or more marks? (correct to one decimal place)
(Histogram data: marks on the horizontal axis, number of students on the vertical axis)
| Marks | Number of Students |
|---|---|
| 150 – 200 | 30 |
| 200 – 250 | 45 |
| 250 – 300 | 60 |
| 300 – 350 | 35 |
| 350 – 400 | 40 |
| 400 – 450 | 35 |
The number of students who obtained less than 250 marks is what per cent more than the number of students who obtained 400 or more marks? (correct to one decimal place)
दिए गए आयतचित्र (histogram) का अध्ययन कीजिए, जो किसी परीक्षा में छात्रों द्वारा प्राप्त अंकों को दर्शाता है, और उसके बाद दिए गए प्रश्न का उत्तर दीजिए।
(आयतचित्र के आँकड़े: क्षैतिज अक्ष पर अंक, ऊर्ध्वाधर अक्ष पर छात्रों की संख्या)
250 से कम अंक प्राप्त करने वाले छात्रों की संख्या, 400 या उससे अधिक अंक प्राप्त करने वाले छात्रों की संख्या से कितने प्रतिशत अधिक है? (दशमलव के एक स्थान तक सही)
(आयतचित्र के आँकड़े: क्षैतिज अक्ष पर अंक, ऊर्ध्वाधर अक्ष पर छात्रों की संख्या)
| अंक | छात्रों की संख्या |
|---|---|
| 150 – 200 | 30 |
| 200 – 250 | 45 |
| 250 – 300 | 60 |
| 300 – 350 | 35 |
| 350 – 400 | 40 |
| 400 – 450 | 35 |
250 से कम अंक प्राप्त करने वाले छात्रों की संख्या, 400 या उससे अधिक अंक प्राप्त करने वाले छात्रों की संख्या से कितने प्रतिशत अधिक है? (दशमलव के एक स्थान तक सही)
- A150%
- B175.8%
- C114.3%
- D100%
Show answer
Concept: Read the class frequencies from the histogram and use .
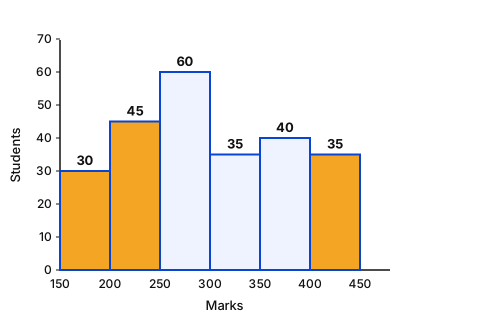
- Less than 250 marks: classes 150–200 and 200–250 .
- 400 or more marks: only class 400–450 .
- .
Trick: Base is the number after 'than' (here 35), so divide the difference by 35.
Answer: (C)
अवधारणा: हिस्टोग्राम से class की frequency पढ़ें और लगाएँ।
- 250 से कम अंक: 150–200 और 200–250 ।
- 400 या अधिक अंक: केवल 400–450 ।
- ।
ट्रिक: 'than' के बाद वाली संख्या (35) आधार होती है — अंतर को 35 से भाग दें।
उत्तर: (C)