Q6521.The price of diesel increased by 16%. A person wants to increase his expenditure on diesel by 10% only. By what percentage, correct to one decimal place, should he reduce his consumption?
डीज़ल के मूल्य में 16% की वृद्धि हुई। एक व्यक्ति डीज़ल पर अपने व्यय में केवल 10% की वृद्धि करना चाहता है। उसे अपनी खपत में कितने प्रतिशत (एक दशमलव स्थान तक सही) की कमी करनी चाहिए?
- A
- B
- C
- D
Show answer
Concept: Expenditure Price Consumption.
- New consumption factor .
- Reduction .
- .
Trick: Reduction .
Answer: (B)
अवधारणा: व्यय मूल्य खपत।
- नई खपत गुणक ।
- कमी ।
- ।
ट्रिक: कमी ।
उत्तर: (B)
SSC CPO Paper IQuantitative AptitudePercentage – Price and ConsumptionSSC CPO Paper I 2020 · 23 Nov Shift 1
Q6522.The given bar graph shows the number of students of two schools over a period of six years.
| Year | School A | School B |
|---|
| 2008 | 640 | 550 |
| 2009 | 800 | 820 |
| 2010 | 500 | 600 |
| 2011 | 700 | 750 |
| 2012 | 900 | 500 |
| 2013 | 750 | 480 |
In the bar graph, what is the ratio of the average of the total students from school A to the average of the total students from school B?
दिया गया दंड आलेख (bar graph) छह वर्षों की अवधि में दो स्कूलों के विद्यार्थियों की संख्या दर्शाता है।
| वर्ष | स्कूल A | स्कूल B |
|---|
| 2008 | 640 | 550 |
| 2009 | 800 | 820 |
| 2010 | 500 | 600 |
| 2011 | 700 | 750 |
| 2012 | 900 | 500 |
| 2013 | 750 | 480 |
दंड आलेख में, स्कूल A के कुल विद्यार्थियों के औसत का स्कूल B के कुल विद्यार्थियों के औसत से अनुपात क्या है?
- A429 : 799
- B429 : 370
- C799 : 429
- D370 : 429
Show answer
Concept: Both averages are over the same years, so ratio of averages ratio of totals.
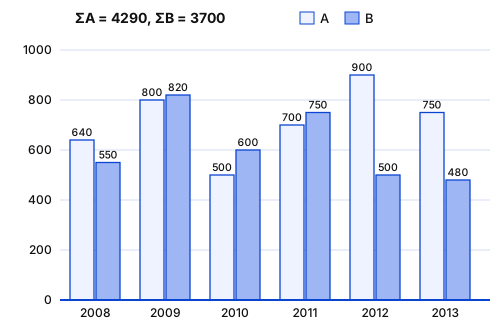
- School A: .
- School B: .
- Ratio .
Trick: Same number of years ⇒ skip dividing by .
Answer: (B)
अवधारणा: दोनों औसत समान वर्षों पर हैं, अतः औसतों का अनुपात योगों का अनुपात।
- स्कूल A: ।
- स्कूल B: ।
- अनुपात ।
ट्रिक: वर्ष समान ⇒ से भाग देने की ज़रूरत नहीं।
उत्तर: (B)
SSC CPO Paper IQuantitative AptitudeData Interpretation – Bar GraphSSC CPO Paper I 2020 · 23 Nov Shift 1
Q6523.The perimeter of a square is the same as the perimeter of a rectangle. The perimeter of the square is 40 m. If its breadth is two-thirds of its length, then the area (in m2) of the rectangle is:
एक वर्ग का परिमाप एक आयत के परिमाप के समान है। वर्ग का परिमाप 40 m है। यदि आयत की चौड़ाई उसकी लंबाई की दो-तिहाई है, तो आयत का क्षेत्रफल (m2 में) है:
- A121
- B96
- C100
- D84
Show answer
Concept: Rectangle perimeter , area .
- .
- .
- Area m.
Trick: Ratio , sum ⇒ and .
Answer: (B)
अवधारणा: आयत का परिमाप , क्षेत्रफल ।
- ।
- ।
- क्षेत्रफल मी।
ट्रिक: अनुपात , योग ⇒ और ।
उत्तर: (B)
SSC CPO Paper IQuantitative AptitudeMensuration – RectangleSSC CPO Paper I 2020 · 23 Nov Shift 1
Q6524.The given histogram shows the height of the students.
| Height of the students (cm) | Number of students |
|---|
| 150-155 | 15 |
| 155-160 | 13 |
| 160-165 | 10 |
| 165-170 | 14 |
| 170-175 | 12 |
| 175-180 | 6 |
The difference between the number of students whose height is between 150-155 cm and the number of students whose height lies between 175-180 cm is:
दिया गया आयतचित्र (histogram) विद्यार्थियों की ऊँचाई दर्शाता है।
| विद्यार्थियों की ऊँचाई (cm) | विद्यार्थियों की संख्या |
|---|
| 150-155 | 15 |
| 155-160 | 13 |
| 160-165 | 10 |
| 165-170 | 14 |
| 170-175 | 12 |
| 175-180 | 6 |
150-155 cm के बीच ऊँचाई वाले विद्यार्थियों की संख्या और 175-180 cm के बीच ऊँचाई वाले विद्यार्थियों की संख्या के बीच का अंतर है:
- A8
- B9
- C3
- D7
Show answer
Concept: Read the bar heights of the two class intervals and subtract.
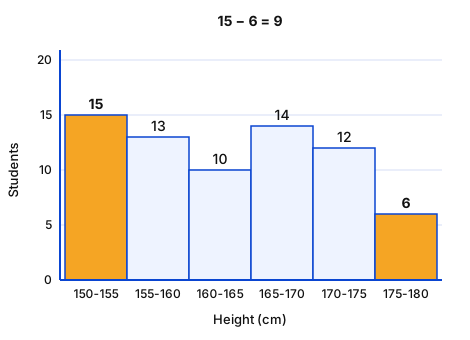
- 150-155 cm: students.
- 175-180 cm: students.
- Difference .
Yaad rakhein: First and last bars — tallest and shortest here.
Answer: (B)
अवधारणा: दोनों वर्ग-अंतरालों के दंडों की ऊँचाई पढ़कर घटाएँ।
- 150-155 सेमी: छात्र।
- 175-180 सेमी: छात्र।
- अंतर ।
याद रखें: पहला और अंतिम दंड — यहाँ सबसे ऊँचा और सबसे छोटा।
उत्तर: (B)
SSC CPO Paper IQuantitative AptitudeData Interpretation – HistogramSSC CPO Paper I 2020 · 23 Nov Shift 1
Q6525.The given bar graph shows the number of students of two schools over a period of six years.
| Year | School A | School B |
|---|
| 2008 | 640 | 550 |
| 2009 | 800 | 820 |
| 2010 | 500 | 600 |
| 2011 | 700 | 750 |
| 2012 | 900 | 500 |
| 2013 | 750 | 480 |
In the bar graph, what is the ratio of the students taken for the years 2009, 2011, 2013 together from school A to the students taken for the years 2008, 2012, 2013 together from school B?
दिया गया दंड आलेख (bar graph) छह वर्षों की अवधि में दो स्कूलों के विद्यार्थियों की संख्या दर्शाता है।
| वर्ष | स्कूल A | स्कूल B |
|---|
| 2008 | 640 | 550 |
| 2009 | 800 | 820 |
| 2010 | 500 | 600 |
| 2011 | 700 | 750 |
| 2012 | 900 | 500 |
| 2013 | 750 | 480 |
दंड आलेख में, स्कूल A से वर्ष 2009, 2011, 2013 के विद्यार्थियों को मिलाकर, स्कूल B से वर्ष 2008, 2012, 2013 के विद्यार्थियों को मिलाकर लिए गए विद्यार्थियों से क्या अनुपात है?
- A17 : 25
- B18 : 25
- C25 : 17
- D25 : 18
Show answer
Concept: Add the required bars of each school and simplify the ratio.
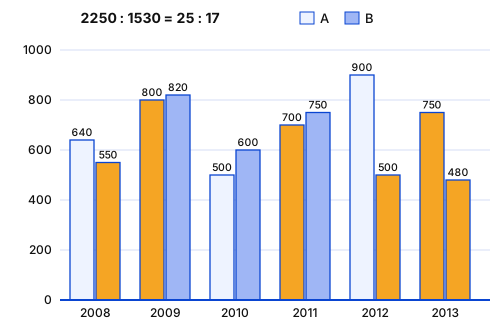
- School A (2009, 2011, 2013): .
- School B (2008, 2012, 2013): .
- .
Trick: First quantity is larger, so the ratio must start with the bigger number — only or remain.
Answer: (C)
अवधारणा: प्रत्येक स्कूल के आवश्यक दंड जोड़कर अनुपात सरल करें।
- स्कूल A (2009, 2011, 2013): ।
- स्कूल B (2008, 2012, 2013): ।
- ।
ट्रिक: पहली राशि बड़ी है, अतः अनुपात बड़ी संख्या से शुरू होगा — केवल या बचते हैं।
उत्तर: (C)
SSC CPO Paper IQuantitative AptitudeData Interpretation – Bar GraphSSC CPO Paper I 2020 · 23 Nov Shift 1
Q6526.The given histogram shows the height of the students.
| Height of the students (cm) | Number of students |
|---|
| 150-155 | 15 |
| 155-160 | 13 |
| 160-165 | 10 |
| 165-170 | 14 |
| 170-175 | 12 |
| 175-180 | 6 |
What is the percentage of students whose height is in the class interval 160-170?
(correct to the nearest integer)
दिया गया आयतचित्र (histogram) विद्यार्थियों की ऊँचाई दर्शाता है।
| विद्यार्थियों की ऊँचाई (cm) | विद्यार्थियों की संख्या |
|---|
| 150-155 | 15 |
| 155-160 | 13 |
| 160-165 | 10 |
| 165-170 | 14 |
| 170-175 | 12 |
| 175-180 | 6 |
वर्ग अंतराल 160-170 में ऊँचाई वाले विद्यार्थियों का प्रतिशत कितना है?
(निकटतम पूर्णांक तक सही)
- A51
- B34
- C25
- D39
Show answer
Concept: Percentage ; 160-170 covers two bars.
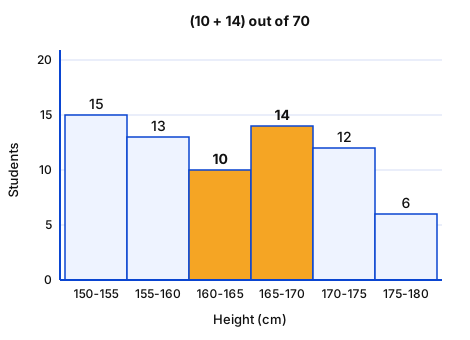
- Total .
- 160-170: .
- .
Trick: is a little more than ⇒ about .
Answer: (B)
अवधारणा: प्रतिशत ; 160-170 में दो दंड आते हैं।
- कुल ।
- 160-170: ।
- ।
ट्रिक: , से थोड़ा अधिक ⇒ लगभग ।
उत्तर: (B)
SSC CPO Paper IQuantitative AptitudeData Interpretation – HistogramSSC CPO Paper I 2020 · 23 Nov Shift 1
Q6527.If each side of a rectangle is decreased by 11%, then its area will decrease by:
यदि एक आयत की प्रत्येक भुजा में 11% की कमी की जाए, तो उसके क्षेत्रफल में कितनी कमी होगी?
- A
- B
- C
- D
Show answer
Concept: Two successive changes and : net .
- Net .
- , i.e. a decrease of .
Trick: ⇒ fall .
Answer: (D)
अवधारणा: दो क्रमिक परिवर्तन और : कुल ।
- कुल ।
- , अर्थात की कमी।
ट्रिक: ⇒ कमी ।
उत्तर: (D)
SSC CPO Paper IQuantitative AptitudePercentage – Area ChangeSSC CPO Paper I 2020 · 23 Nov Shift 1
Q6528.The value of is:
का मान है:
- A
- B
- C
- D
Show answer
Concept: Order: Brackets → "of" → ÷ and × (left to right) → + and −.
- .
- ; .
- ; .
- .
Trick: Result is clearly positive and above ⇒ only fits.
Answer: (D)
अवधारणा: क्रम: कोष्ठक → "of" → ÷ और × (बाएँ से दाएँ) → + और −।
- ।
- ; ।
- ; ।
- ।
ट्रिक: उत्तर स्पष्टतः धनात्मक और से अधिक ⇒ केवल ।
उत्तर: (D)
SSC CPO Paper IQuantitative AptitudeSimplification (BODMAS)SSC CPO Paper I 2020 · 23 Nov Shift 1
Q6529.If , the value of is:
यदि है, तो का मान है:
- A
- B
- C8
- D
Show answer
Concept: , , and .
- .
- ; .
- .
Trick: Angles adding to in a product of give .
Answer: (A)
अवधारणा: , और ।
- ।
- ; ।
- ।
ट्रिक: योग वाले कोणों के का गुणनफल होता है।
उत्तर: (A)
SSC CPO Paper IQuantitative AptitudeTrigonometry – Complementary AnglesSSC CPO Paper I 2020 · 23 Nov Shift 1
Q6530.The sides of a triangle are 24 cm, 26 cm and 10 cm. At each of its vertices, circles of radius 4.2 cm are drawn. What is the area (in cm2) of the triangle, excluding the portion covered by the sectors of the circles?
()
एक त्रिभुज की भुजाएँ 24 cm, 26 cm और 10 cm हैं। इसके प्रत्येक शीर्ष पर 4.2 cm त्रिज्या के वृत्त खींचे गए हैं। वृत्तों के त्रिज्यखंडों द्वारा घेरे गए भाग को छोड़कर, त्रिभुज का क्षेत्रफल (cm2 में) कितना है?
()
- A120
- B105.86
- C92.28
- D27.72
Show answer
Concept: The three angles of a triangle add to , so the three sectors together form a semicircle.
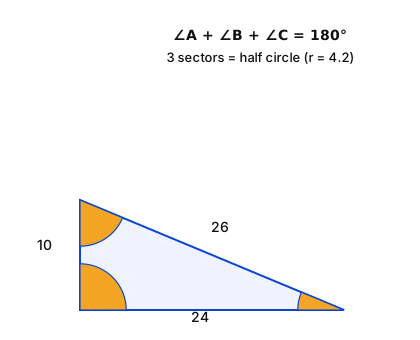
- ⇒ right triangle; area .
- Sectors .
- Required area cm.
Trick: Any triangle: total sector area — no need to find each angle.
Answer: (C)
अवधारणा: त्रिभुज के तीनों कोणों का योग , अतः तीनों त्रिज्यखंड मिलकर एक अर्धवृत्त बनाते हैं।
- ⇒ समकोण त्रिभुज; क्षेत्रफल ।
- त्रिज्यखंड ।
- अभीष्ट क्षेत्रफल सेमी।
ट्रिक: किसी भी त्रिभुज में कुल त्रिज्यखंड क्षेत्रफल ।
उत्तर: (C)
SSC CPO Paper IQuantitative AptitudeMensuration – Triangle and SectorsSSC CPO Paper I 2020 · 23 Nov Shift 1
Q6531.If , then the value of is:
यदि है, तो का मान है:
- A14
- B6
- C4
- D8
Show answer
Concept: .
- .
- (positive as ).
Trick: Chain : each step "add , take root".
Answer: (C)
अवधारणा: ।
- ।
- ( अतः धनात्मक)।
ट्रिक: श्रृंखला : हर चरण में " जोड़ो, मूल लो"।
उत्तर: (C)
SSC CPO Paper IQuantitative AptitudeAlgebra – Reciprocal IdentitiesSSC CPO Paper I 2020 · 23 Nov Shift 1
Q6532.A circle is inscribed in a triangle ABC. It touches sides AB, BC and AC at points R, P and Q, respectively. If AQ = 3.5 cm, PC = 4.5 cm and BR = 7 cm, then the perimeter (in cm) of the triangle is:
एक त्रिभुज ABC के अंतर्गत एक वृत्त बनाया गया है। यह भुजाओं AB, BC और AC को क्रमशः बिंदुओं R, P और Q पर स्पर्श करता है। यदि AQ = 3.5 cm, PC = 4.5 cm और BR = 7 cm है, तो त्रिभुज का परिमाप (cm में) है:
- A30
- B15
- C28
- D45
Show answer
Concept: Tangents drawn from an external point to a circle are equal.
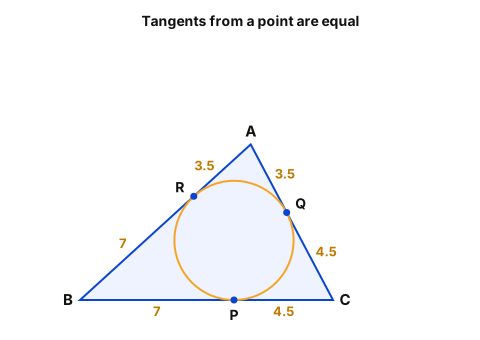
- AR = AQ , BP = BR , CQ = CP .
- Perimeter cm.
Trick: Perimeter (sum of the three distinct tangent lengths).
Answer: (A)
अवधारणा: बाहरी बिंदु से वृत्त पर खींची गई स्पर्श रेखाएँ बराबर होती हैं।
- AR = AQ , BP = BR , CQ = CP ।
- परिमाप सेमी।
ट्रिक: परिमाप (तीनों अलग स्पर्शरेखा लंबाइयों का योग)।
उत्तर: (A)
SSC CPO Paper IQuantitative AptitudeCircles – TangentsSSC CPO Paper I 2020 · 23 Nov Shift 1
Q6533.The given pie chart represents the popularity of ice-cream flavours in the year 2005.
| Flavour (2005) | Share |
|---|
| Chocolate | 32.7% |
| Vanilla | 21.9% |
| Strawberry | 18.9% |
| Other | 15.7% |
| Butterscotch | 10.8% |
In 2005, if 10% of the ‘other’ category is mix fruit flavour and 1570 people surveyed preferred mix fruit flavour, then how many people were surveyed?
दिया गया पाई चार्ट वर्ष 2005 में आइसक्रीम के स्वादों की लोकप्रियता को दर्शाता है।
| स्वाद (2005) | हिस्सा |
|---|
| चॉकलेट | 32.7% |
| वनीला | 21.9% |
| स्ट्रॉबेरी | 18.9% |
| अन्य | 15.7% |
| बटरस्कॉच | 10.8% |
2005 में, यदि ‘अन्य’ श्रेणी का 10% मिक्स फ्रूट स्वाद है और सर्वेक्षण किए गए 1570 लोगों ने मिक्स फ्रूट स्वाद को प्राथमिकता दी, तो कितने लोगों का सर्वेक्षण किया गया था?
- A1,75,000
- B4,00,000
- C1,50,000
- D1,00,000
Show answer
Concept: Find the share of mix fruit in the whole survey, then scale up.
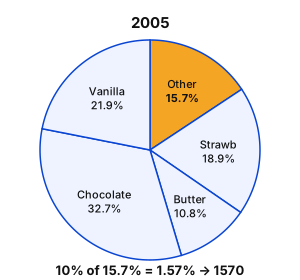
- Other ; mix fruit of of all.
- people.
- .
Trick: and have the same digits ⇒ total .
Answer: (D)
अवधारणा: पूरे सर्वे में मिक्स फ्रूट का हिस्सा निकालें, फिर अनुपात से बढ़ाएँ।
- Other ; मिक्स फ्रूट का ।
- लोग।
- ।
ट्रिक: और के अंक समान ⇒ कुल ।
उत्तर: (D)
SSC CPO Paper IQuantitative AptitudeData Interpretation – Pie ChartSSC CPO Paper I 2020 · 23 Nov Shift 1
Q6534.The average of twelve numbers is 39. The average of the last five numbers is 35, and that of the first four numbers is 40. The fifth number is 6 less than the sixth number and 5 more than the seventh number. The average of the fifth and sixth numbers is:
बारह संख्याओं का औसत 39 है। अंतिम पाँच संख्याओं का औसत 35 है, और पहली चार संख्याओं का औसत 40 है। पाँचवीं संख्या, छठी संख्या से 6 कम और सातवीं संख्या से 5 अधिक है। पाँचवीं और छठी संख्याओं का औसत है:
- A47
- B39
- C44
- D50
Show answer
Concept: Sum average count; the middle numbers are what remains.
- Total ; first four , last five .
- 5th + 6th + 7th .
- Let 5th : 6th , 7th ⇒ .
- 6th ; average .
Trick: Average of 5th and 6th once is known.
Answer: (A)
अवधारणा: योग औसत संख्या; बीच की संख्याएँ शेष से मिलती हैं।
- कुल ; पहली चार , अंतिम पाँच ।
- 5वीं + 6वीं + 7वीं ।
- 5वीं : 6वीं , 7वीं ⇒ ।
- 6वीं ; औसत ।
ट्रिक: मिलने पर 5वीं और 6वीं का औसत ।
उत्तर: (A)
SSC CPO Paper IQuantitative AptitudeAverageSSC CPO Paper I 2020 · 23 Nov Shift 1
Q6535.The given pie charts represent the popularity of ice-cream flavours in the years 2005 and 2015.
| Flavour | 2005 | 2015 |
|---|
| Chocolate | 32.7% | 25.8% |
| Vanilla | 21.9% | 16.5% |
| Strawberry | 18.9% | 20.5% |
| Butterscotch | 10.8% | 16.6% |
| Other | 15.7% | 20.6% |
If a percentage point shift results in annual additional sales of ₹10,000, how much (in ₹), did the combined annual strawberry and butterscotch sales increase from 2005 to 2015?
दिए गए पाई चार्ट वर्ष 2005 और 2015 में आइसक्रीम के स्वादों की लोकप्रियता को दर्शाते हैं।
| स्वाद | 2005 | 2015 |
|---|
| चॉकलेट | 32.7% | 25.8% |
| वनीला | 21.9% | 16.5% |
| स्ट्रॉबेरी | 18.9% | 20.5% |
| बटरस्कॉच | 10.8% | 16.6% |
| अन्य | 15.7% | 20.6% |
यदि एक प्रतिशत बिंदु के बदलाव से ₹10,000 की वार्षिक अतिरिक्त बिक्री होती है, तो 2005 से 2015 तक स्ट्रॉबेरी और बटरस्कॉच की संयुक्त वार्षिक बिक्री में कितनी (₹ में) वृद्धि हुई?
- A₹74,000
- B₹37,000
- C₹65,000
- D₹10,000
Show answer
Concept: Find the change in percentage points of the two flavours together, then multiply by ₹10,000.
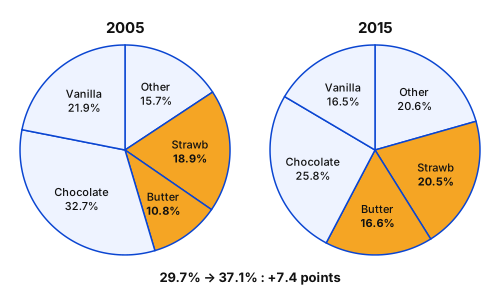
- 2005: .
- 2015: .
- Shift points ⇒ increase ₹.
Trick: Strawberry , Butterscotch ⇒ points.
Answer: (A) ₹74,000
अवधारणा: दोनों फ्लेवरों का प्रतिशत-अंक परिवर्तन निकालकर ₹10,000 से गुणा करें।
- 2005: ।
- 2015: ।
- परिवर्तन अंक ⇒ वृद्धि ₹।
ट्रिक: Strawberry , Butterscotch ⇒ अंक।
उत्तर: (A) ₹74,000
SSC CPO Paper IQuantitative AptitudeData Interpretation – Pie ChartSSC CPO Paper I 2020 · 23 Nov Shift 1
Q6536.What is the least number which when divided by 15, 18 and 36 leaves the same remainder 9 in each case and is divisible by 11?
वह छोटी से छोटी संख्या कौन-सी है जिसे 15, 18 और 36 से विभाजित करने पर प्रत्येक स्थिति में समान शेषफल 9 प्राप्त होता है और जो 11 से विभाज्य है?
- A1269
- B1071
- C1089
- D1080
Show answer
Concept: Required number , choose the least making it divisible by .
- ; number .
- , so need divisible by .
- : ✓ ⇒ number .
Trick: Check options: and .
Answer: (C)
अवधारणा: अभीष्ट संख्या ; सबसे छोटा लें जिससे संख्या से विभाज्य हो।
- ; संख्या ।
- , अतः को से विभाज्य होना चाहिए।
- : ✓ ⇒ संख्या ।
ट्रिक: विकल्प जाँच: और ।
उत्तर: (C)
SSC CPO Paper IQuantitative AptitudeLCM – Remainder ProblemsSSC CPO Paper I 2020 · 23 Nov Shift 1
Q6537.If is divided by 12, then what is the remainder?
यदि को 12 से विभाजित किया जाए, तो शेषफल क्या होगा?
- A3
- B6
- C9
- D8
Show answer
Concept: Remainder of a product product of individual remainders (then reduce).
- : mod last two digits ; digit sum mod ⇒ remainder mod .
- ; .
- remainder .
Trick: Split to find the remainder of a big number quickly.
Answer: (B)
अवधारणा: गुणनफल का शेष अलग-अलग शेषों का गुणनफल (फिर पुनः भाग)।
- : से अंतिम दो अंक ; अंकों का योग से शेष ⇒ से शेष ।
- ; ।
- शेष ।
ट्रिक: बड़ी संख्या का शेष: में तोड़कर निकालें।
उत्तर: (B)
SSC CPO Paper IQuantitative AptitudeRemainder TheoremSSC CPO Paper I 2020 · 23 Nov Shift 1
Q6538.The average weight of A, B and C is 65 kg. If the average weight of A and B is 63.5 kg, and the average weight of A and C is 67.5 kg, then the weight of A (in kg) is:
A, B और C का औसत भार 65 kg है। यदि A और B का औसत भार 63.5 kg है, और A और C का औसत भार 67.5 kg है, तो A का भार (kg में) है:
- A67
- B60
- C68
- D65
Show answer
Concept: Convert averages to sums and combine.
- A + B + C ; A + B ; A + C .
- C .
- A kg.
Trick: A .
Answer: (A)
अवधारणा: औसत को योग में बदलकर जोड़ें-घटाएँ।
- A + B + C ; A + B ; A + C ।
- C ।
- A किग्रा।
ट्रिक: A ।
उत्तर: (A)
SSC CPO Paper IQuantitative AptitudeAverageSSC CPO Paper I 2020 · 23 Nov Shift 1
Q6539.A train running at 74 km/h crosses another train running at 52 km/h in the opposite direction in 12 seconds. If the length of is two-thirds that of , then what is the length of (in m)?
74 km/h की चाल से चल रही एक रेलगाड़ी , विपरीत दिशा में 52 km/h की चाल से चल रही दूसरी रेलगाड़ी को 12 सेकंड में पार करती है। यदि की लंबाई की लंबाई की दो-तिहाई है, तो की लंबाई (m में) कितनी है?
- A210
- B200
- C252
- D168
Show answer
Concept: Opposite directions: relative speed sum; distance covered sum of lengths.
- Relative speed km/h m/s.
- Sum of lengths m.
- m.
Trick: Lengths in ratio ⇒ .
Answer: (C)
अवधारणा: विपरीत दिशा: सापेक्ष चाल योग; तय दूरी लंबाइयों का योग।
- सापेक्ष चाल किमी/घं मी/से।
- लंबाइयों का योग मी।
- मी।
ट्रिक: लंबाइयाँ ⇒ ।
उत्तर: (C)
SSC CPO Paper IQuantitative AptitudeProblems on TrainsSSC CPO Paper I 2020 · 23 Nov Shift 1
Q6540.The given bar graph shows the number of students of two schools over a period of six years.
| Year | School A | School B |
|---|
| 2008 | 640 | 550 |
| 2009 | 800 | 820 |
| 2010 | 500 | 600 |
| 2011 | 700 | 750 |
| 2012 | 900 | 500 |
| 2013 | 750 | 480 |
In the bar graph, in which year is the sum of the students from schools A and B taken together, the minimum?
दिया गया दंड आलेख (bar graph) छह वर्षों की अवधि में दो स्कूलों के विद्यार्थियों की संख्या दर्शाता है।
| वर्ष | स्कूल A | स्कूल B |
|---|
| 2008 | 640 | 550 |
| 2009 | 800 | 820 |
| 2010 | 500 | 600 |
| 2011 | 700 | 750 |
| 2012 | 900 | 500 |
| 2013 | 750 | 480 |
दंड आलेख में, किस वर्ष स्कूल A और B के विद्यार्थियों का कुल योग न्यूनतम है?
- A2010
- B2013
- C2011
- D2012
Show answer
Concept: Add both bars for each year and pick the smallest total.
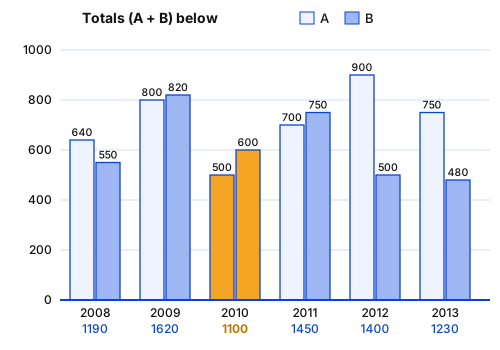
- 2008: , 2009: , 2010: .
- 2011: , 2012: , 2013: .
- Minimum in 2010.
Trick: Compare only the option years: 2010 () is lowest.
Answer: (A) 2010
अवधारणा: प्रत्येक वर्ष के दोनों दंड जोड़कर सबसे छोटा योग चुनें।
- 2008: , 2009: , 2010: ।
- 2011: , 2012: , 2013: ।
- न्यूनतम , वर्ष 2010।
ट्रिक: केवल विकल्प वाले वर्ष जाँचें: 2010 () सबसे कम।
उत्तर: (A) 2010
SSC CPO Paper IQuantitative AptitudeData Interpretation – Bar GraphSSC CPO Paper I 2020 · 23 Nov Shift 1

